PRODUCT DESIGN CASE STUDY
Transforming the Marketing Audit Experience — From Request to Insights
overview
Finiding the Problem
A slow, manual & complex multi-platform audit report process.
Creating multi-platform marketing performance audits was a manual, slow, and error-prone process that required extensive human effort, often taking 7 to 15 days to deliver.
Key Issues Identified:
- Users relied on email or chat to submit audit requests
- Support and audit teams engaged in multiple back-and-forth follow-ups for missing details.
- Comparing performance across time periods and platforms was challenging for both agencies and their clients.
Research
Understanding bottlenecks in both audit request submission and report consumption experience.
We collborated with agencies, marketers and internal audit specialists to find out the problems and gain insights.
Sources:
- Interviews with 5 agencies
- Feedback sessions with internal audit specialists
- Smartlook session recordings (20+ sessions)
- Reviewed 20+ past manual audit reports
Next, we drafted a research questionnaire and sent it via email to active users who had set up campaigns recently.
Sample Questions:
- How do you currently submit audit requests?
- What details confuse you when sending an audit request?
- As a marketing agency,how do you currently explain performance metrics to your clients?
- What’s missing in the current report format?
- How important is period-over-period comparison for you?
- If not using OptimizeApp, how do you currently consolidate a marketing report across platforms like Meta, Google, Snapchat, and TikTok Ads Manager?

Key insights
Research helped us uncover key challenges users face while requesting and understanding the complex report.
Users needed a simpliefied process to request report.
Users struggled to interpret raw data-heavy spreadsheets.
No easy way to compare current and previous period performance
Reports lacked platform-level breakdowns & comparision
Finding a Solution
Using user feedback and internal team insights to redesign both the audit request flow and the final report output for speed, clarity, and impact.
Simplify and guide the audit request submission process
Redesign the audit report structure for clarity and insights.
Design strategy
Turning research insights into user-centered design solutions.
Research insights directly shaped the strategy by focusing on clarity, simplicity, and detailed insights.
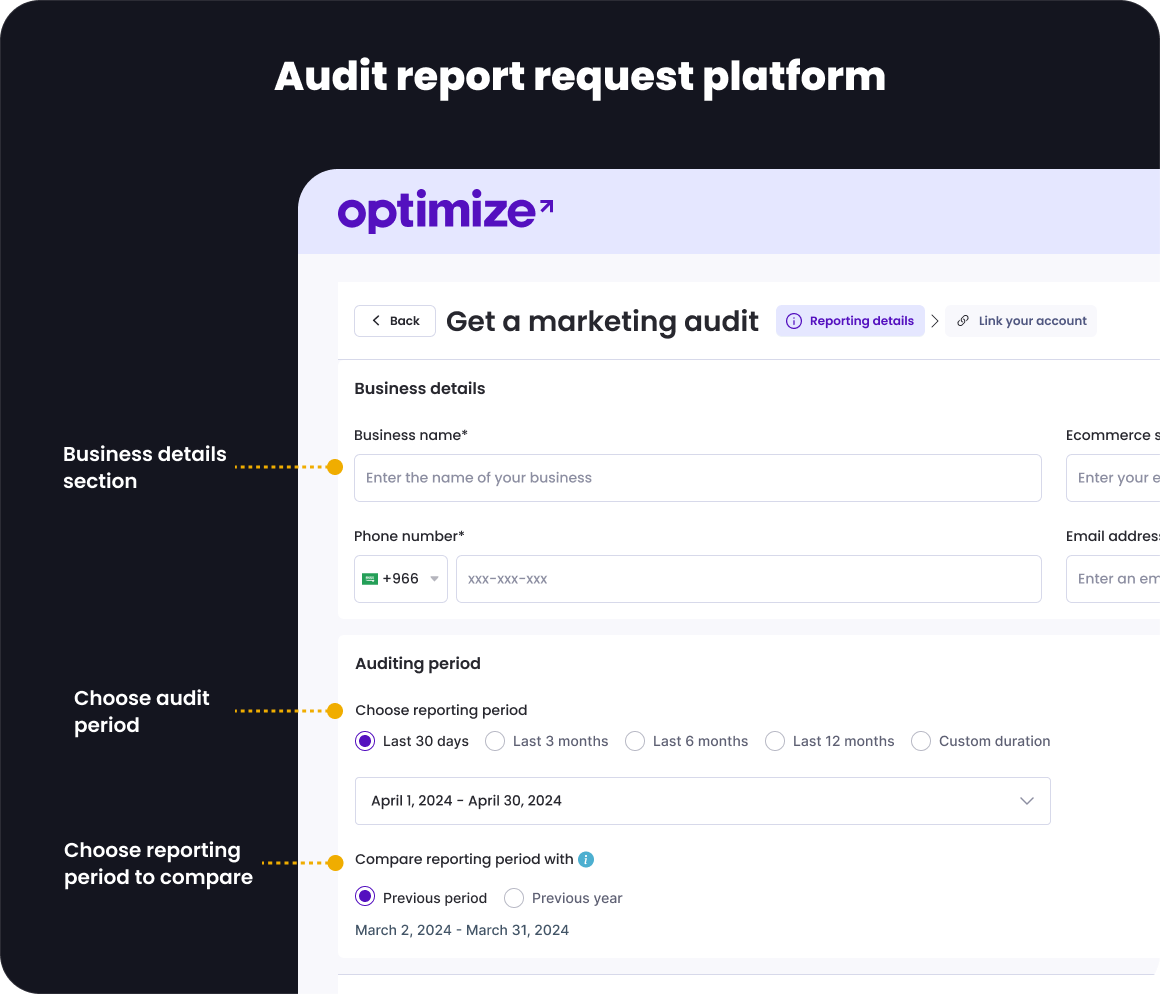
Part A: Audit request tool redesign
Access for registered and non-Registered users
Allow even non-OptimizeApp users to submit audit requests by first collecting essential business details (Business Name, Website URL, Contact Info).
Customizable audit period selection with comparison option
Enable users to select both a primary audit period and an optional comparison period to analyze performance trends over time.
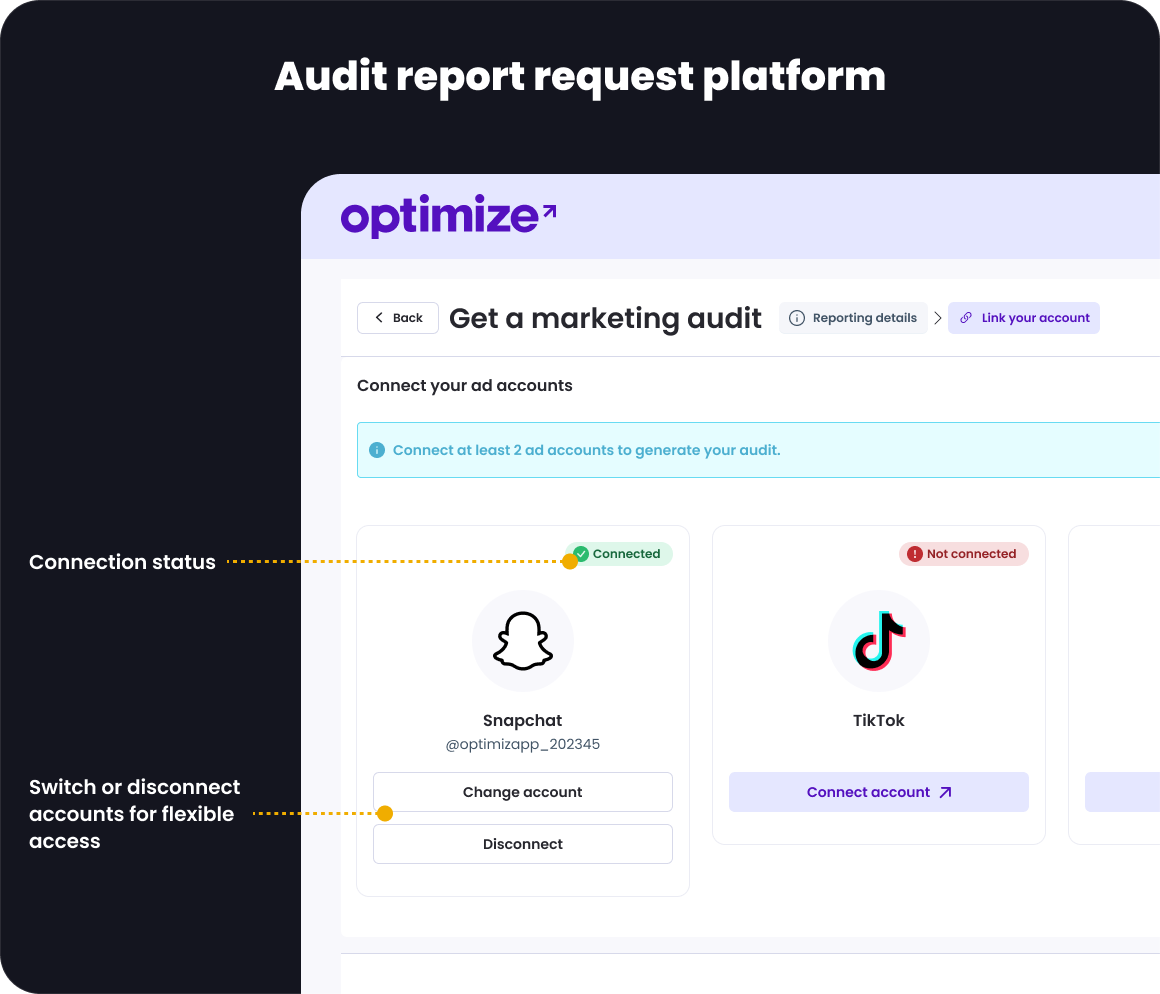
Simplify Multi-Platform Connection Flow
Redesign the connection process for Google, Meta, TikTok, and Snapchat ad accounts to minimize confusion and setup time.
Progress Tracking with Inline Validation
Introduce progress indicators and inline form validations at each step, ensuring users knew their place in the flow and minimized submission errors.
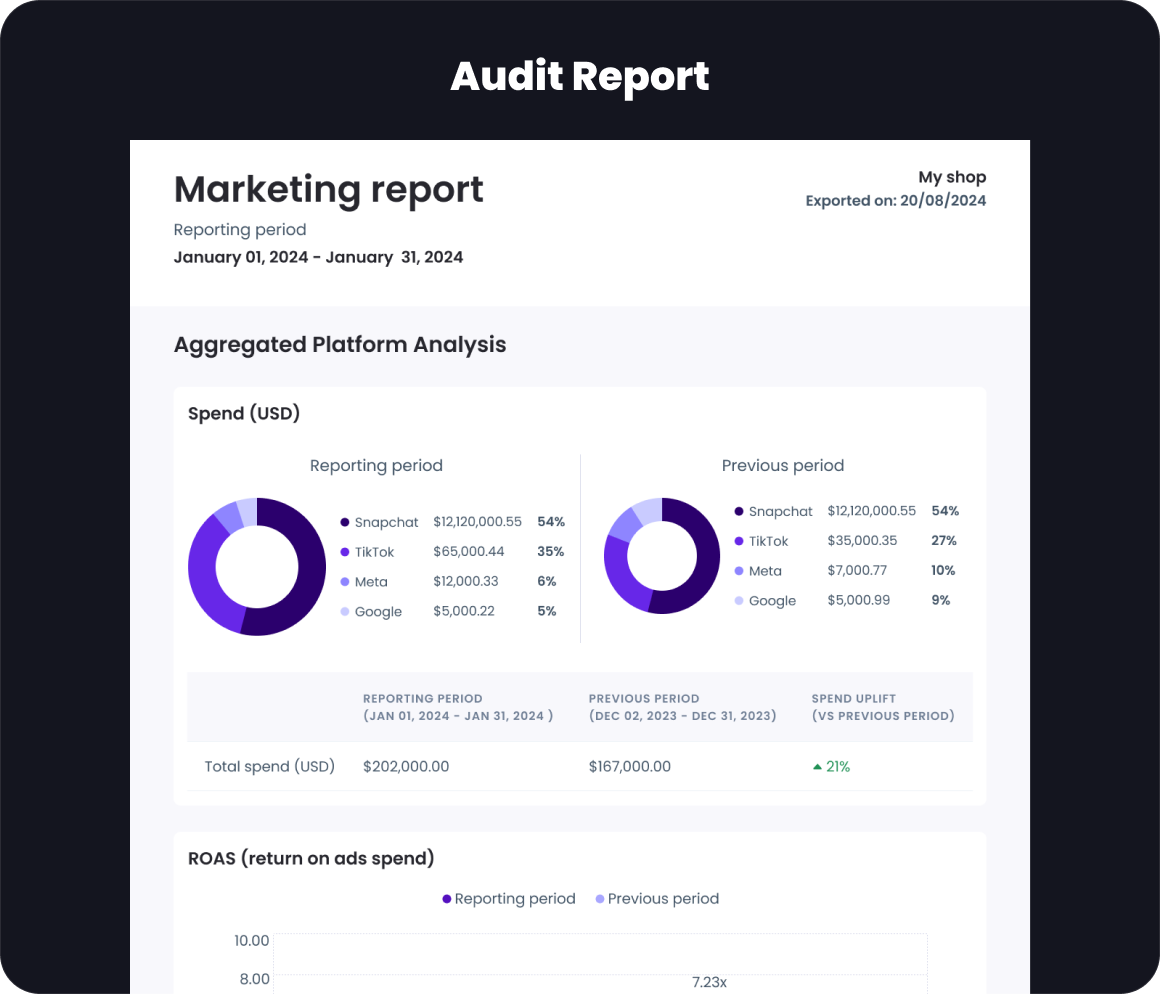
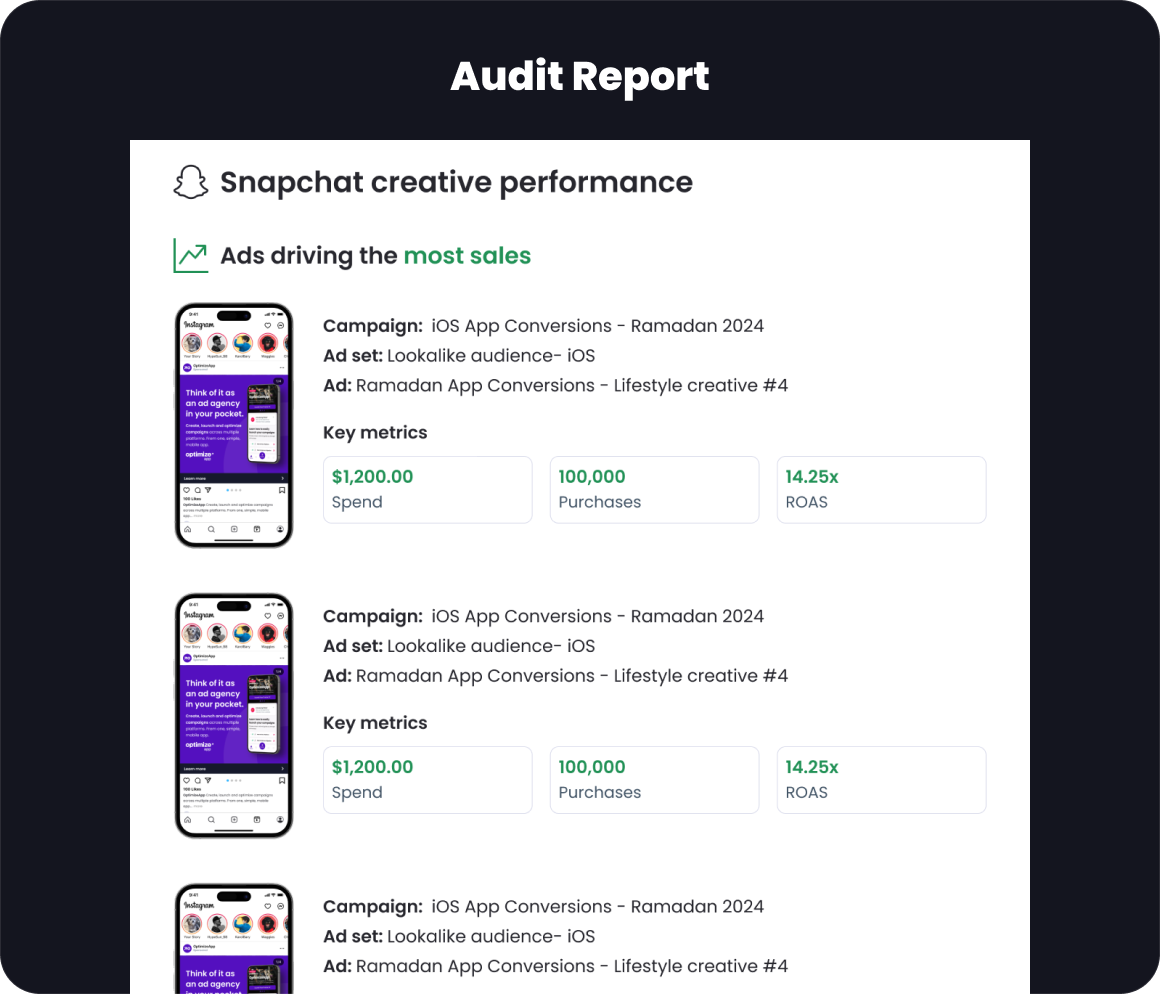
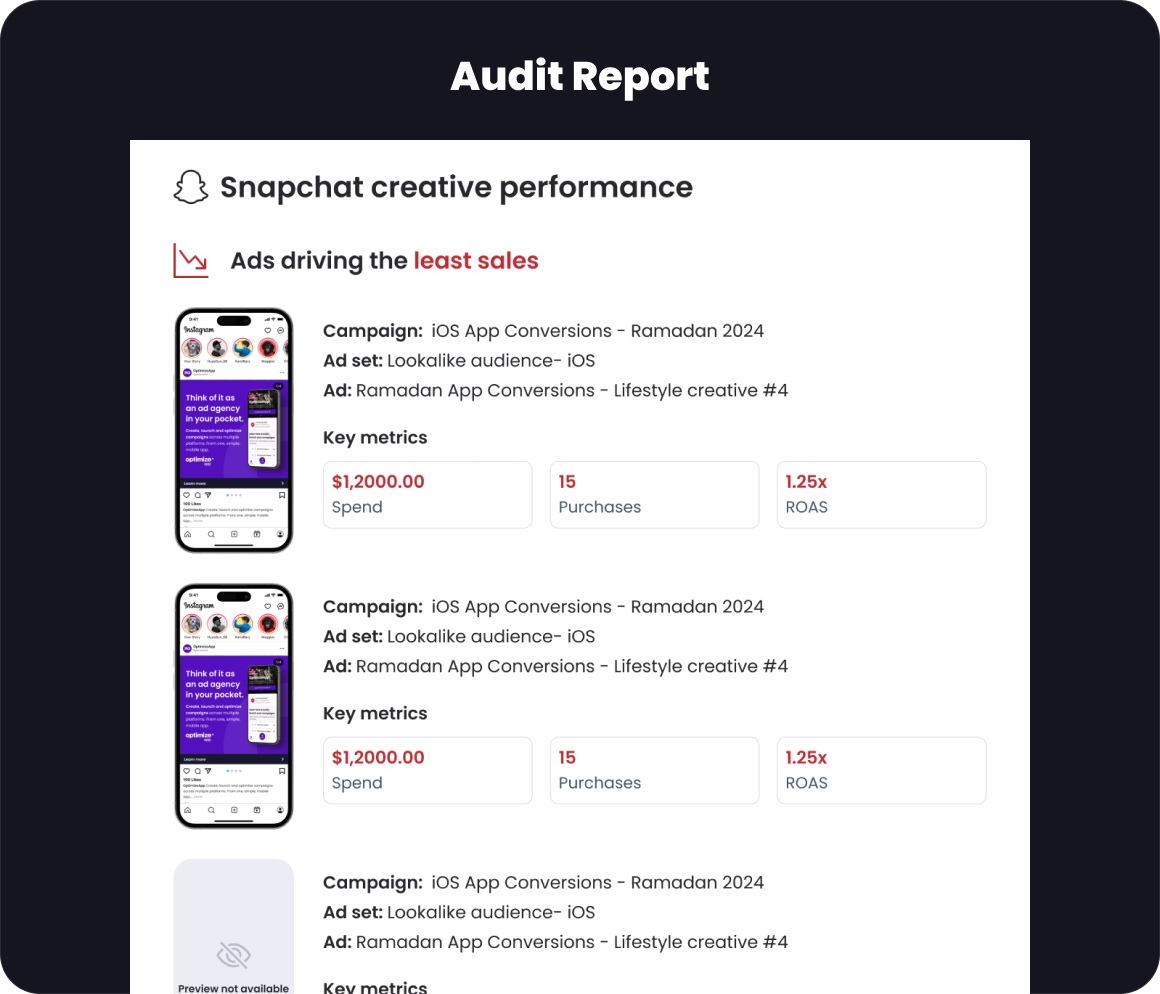
Part B: Audit report restructure
Redesiging the repor from raw spreadsheets to a narrative, insight-driven document by adding the following key sections.
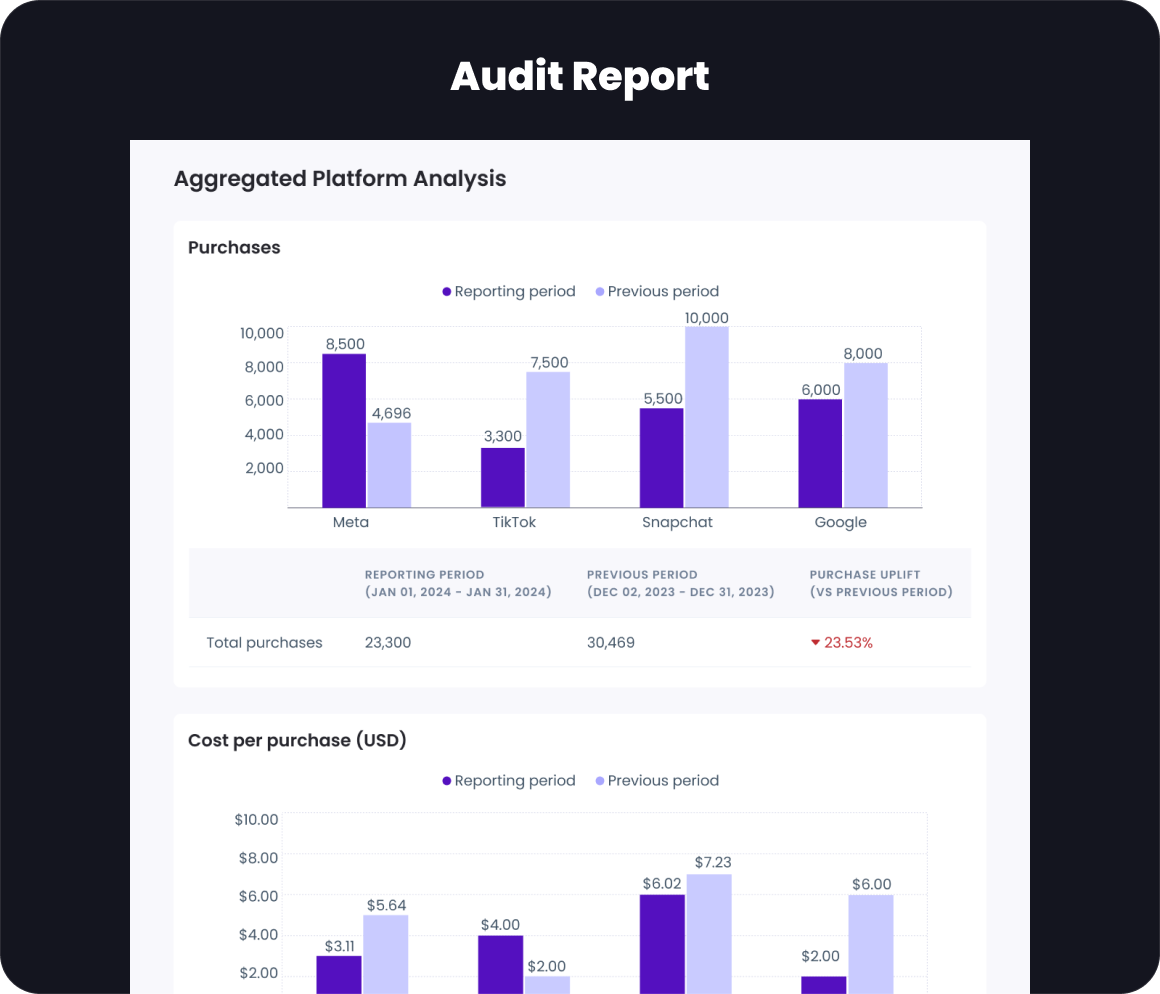
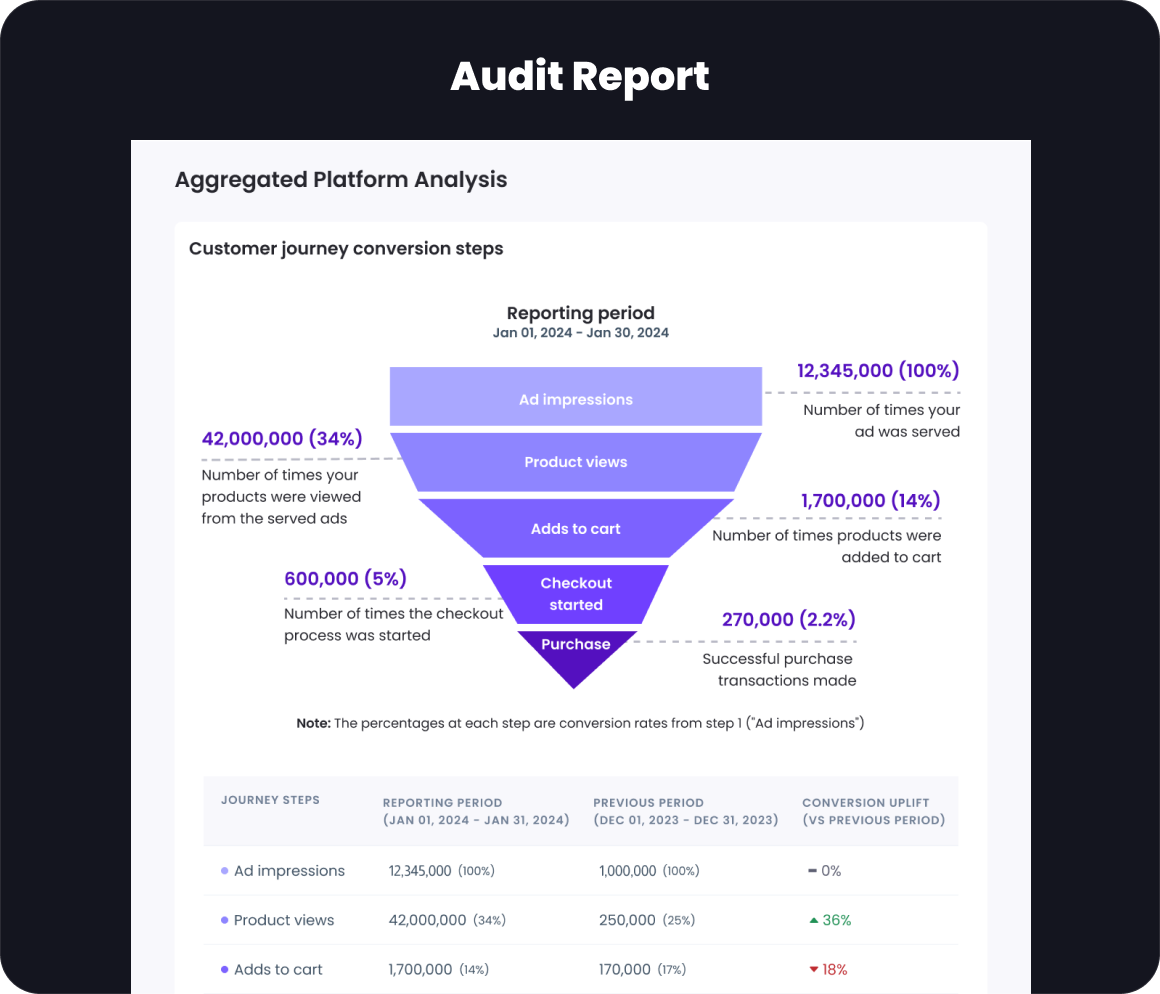
Aggregated Platform Analysis
- Spend vs ROAS
- Purchase vs CPP
- Customer journey funnel steps (awareness → conversion)
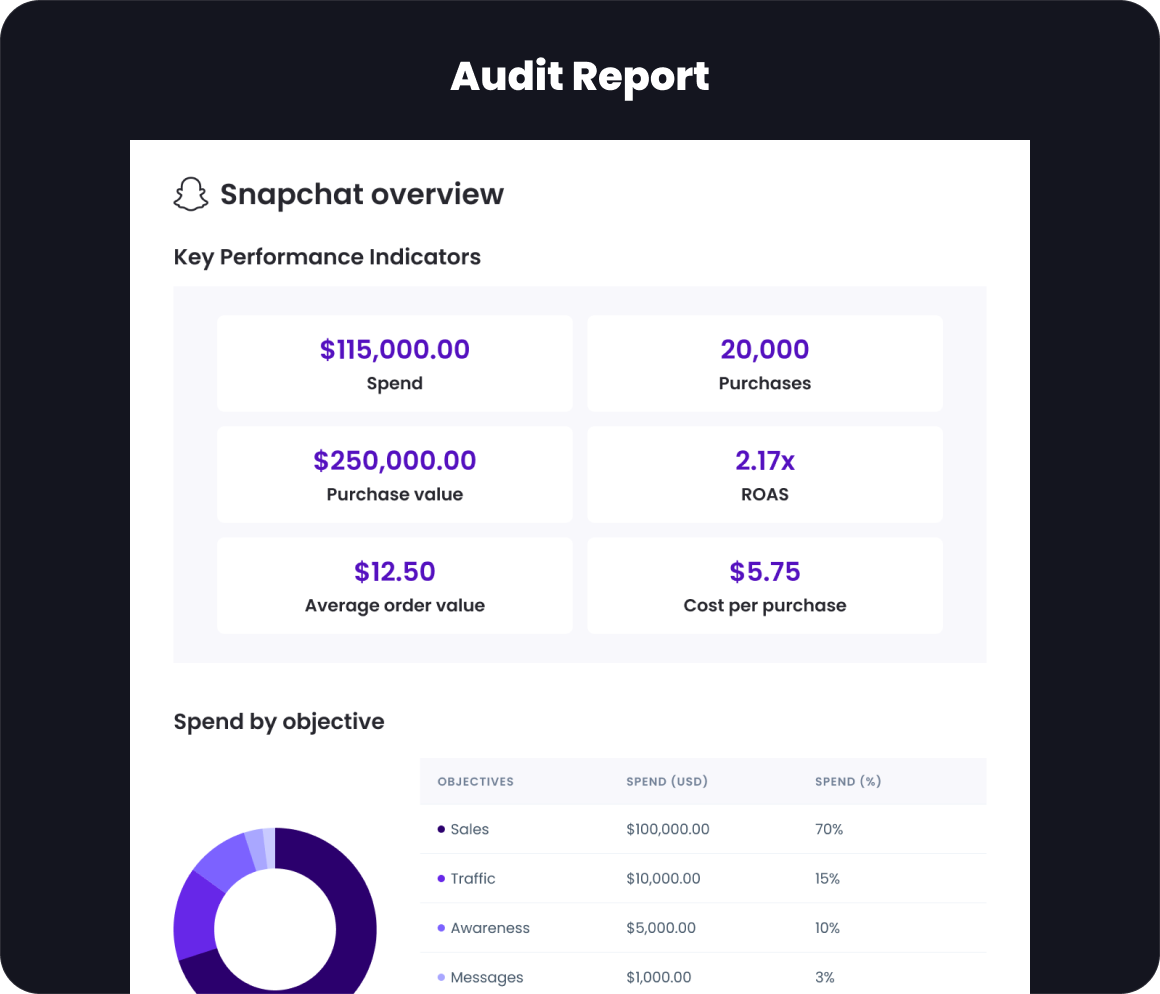
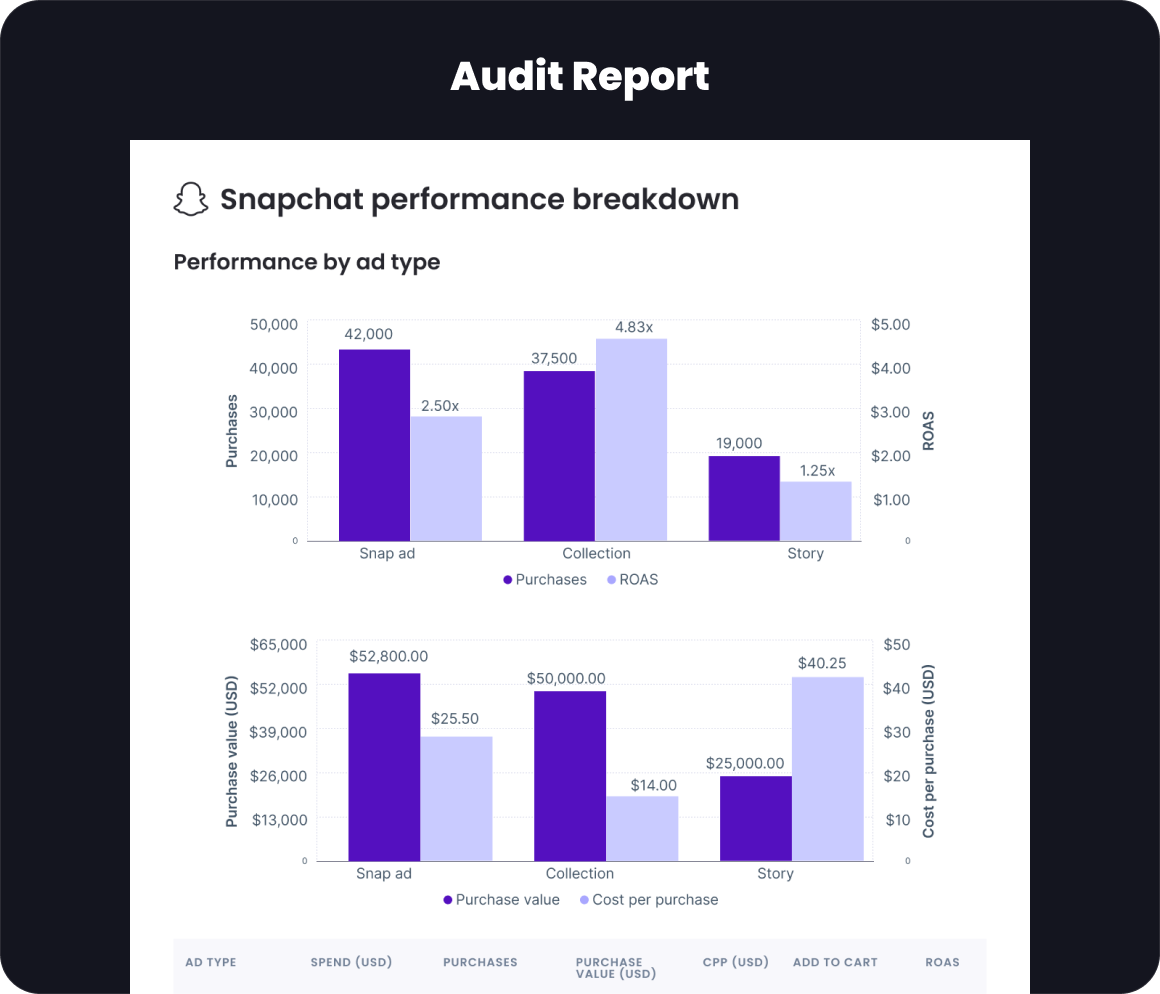
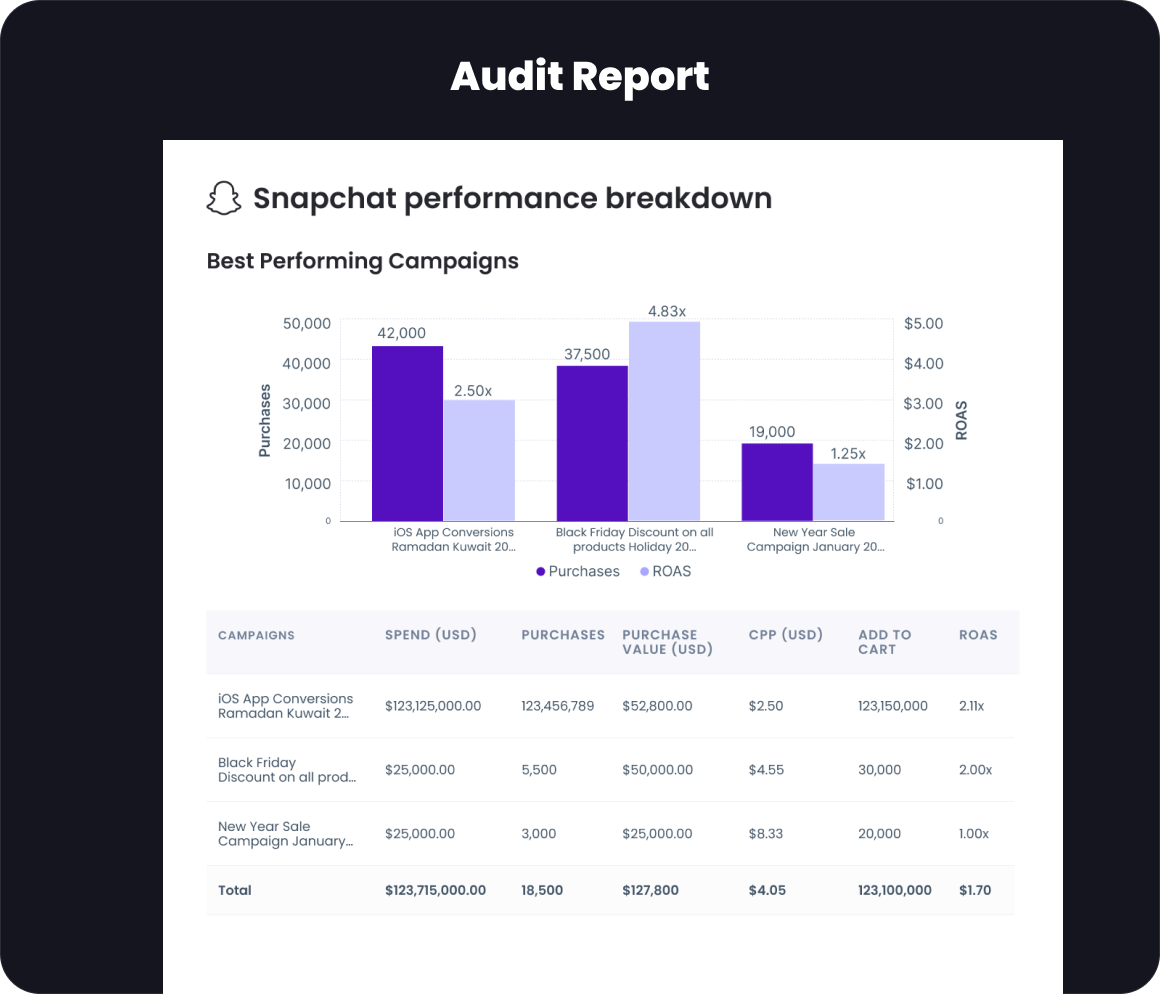
Performance Overview by Platform
- Purchase vs ROAS
- Purchase value vs CPP
Period-over-Period Comparison
Visualized performance trends between current and previous periods
Platform-specific Ad Metrics
Impressions, Clicks, CTR, Conversions, etc.
Visual Storytelling
Funnel charts, bar graphs, tables, and KPI summaries
Automated Data Aggregation and Report Generation
Automatically combined performance metrics across platforms, eliminating manual data compilation, reducing the turn arount time.
Visual design
Mockups
Testing
Internal Testing:
- Tested the report request tool with internal teams
- Gained insights from developers on platform connection flow
- Reviewed redesigned report with internal audit specialists
Beta Rollout with Agency Users:
- 5 registered and 5 non-registered marketers onboarded to test.
- 90% completed their first audit request without external help
- Received positive feedback on the simplicity, clarity, and quick turnaround time of the report request tool, as well as the quality and presentation of the report information.
Impact
Here are a few outcomes:
Increase in audit tool users within the first month of rollout
boost in subscription revenue from agencies adopting audit automation
Additional outcomes
| Metric | Before | After |
|---|---|---|
| Audit Turnaround Time | 7–15 Days | 2–4 Hours |
| Audit Support Queries | High | Dropped by 40% |
| Request Form Drop-off | ~30% | Below 10% |
| Report Readability Score (User Survey) | Low | 85% rated as “Clear/Insightful” |
| Agency Satisfaction | Untracked | 90% rated process as “Easy” or “Very Easy” |
Final thoughts
Optimizing Both Process and Output: Faster Requests, Smarter Reports.
This project solved both operational and user-facing challenges—compressing time-to-delivery and increasing the value of the output for agencies and pro marketers. The redesign is already reducing support dependency and enabling faster, data-driven decision-making for clients.